What You Really Need To Know About Home Prices
What You Really Need To Know About Home Prices

Recent data from Fannie Mae reveals that nearly one-fourth of individuals still anticipate a decline in home prices. If you're among those concerned, here's some information to consider.
A lot of that fear is probably coming from what you’re hearing in the media or reading online. But here’s the thing to remember. Negative news sells. That means, you may not be getting the full picture. You may only be getting the clickbait version. As Jay Thompson, a Real Estate Industry Consultant, explains:
“Housing market headlines are everywhere. Many are quite sensational, ending with exclamation points or predicting impending doom for the industry. Clickbait, the sensationalizing of headlines and content, has been an issue since the dawn of the internet, and housing news is not immune to it.”
Here’s a look at the data to set the record straight.
Home Prices Rose the Majority of the Past Year
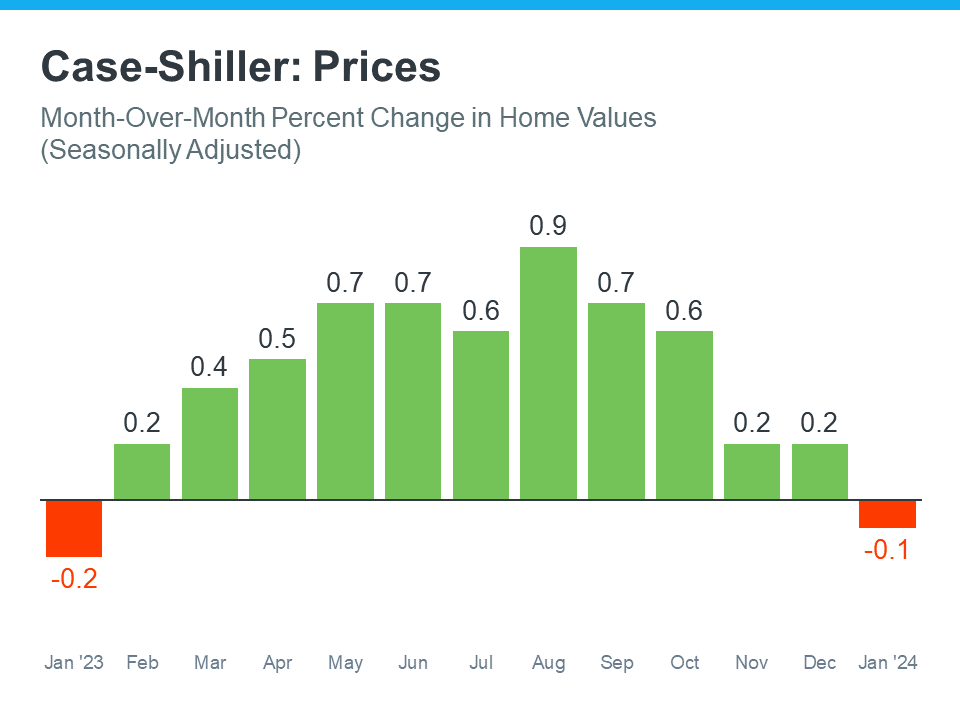
Case-Shiller releases a report each month on the percent of monthly home price changes. If you look at their data from January 2023 through the latest numbers available, here’s what you’d see:
What stands out to you when examining this graph? Your perception might be influenced by the color you're drawn to. Those focusing on the green notice the overall upward trend in home prices over the past year. Conversely, individuals drawn to the red might fixate on the two minor declines. This tendency to emphasize negative aspects is common in media coverage, sometimes overshadowing the broader perspective.
Here’s what this data really says. There’s a lot more green in that graph than red. And even for the two red bars, they’re so slight, they’re practically flat. If you look at the year as a whole, home prices still rose overall.
It’s perfectly normal in the housing market for home price growth to slow down in the winter. That’s because fewer people move during the holidays and at the start of the year, so there’s not as much upward pressure on home prices during that time. That’s why, even the green bars toward the end of the year show smaller price gains.
The overarching story is that prices went up last year, not down.
To sum all that up, the source for that data in the graph above, Case Shiller, explains it like this:
“Month-over-month numbers were relatively flat, . . . However, the annual growth was more significant for both indices, rising 7.4 percent and 6.6 percent, respectively.”
If one of the expert organizations tracking home price trends says the very slight dips are nothing to worry about, why be concerned? Even Case-Shiller is drawing your attention to how those were virtually flat and how home prices actually grew over the year.
Bottom Line
The data indicates a general increase in home prices over the past year. If you're curious about how this trend reflects on home prices in our local area, I'd be happy to discuss further.
Categories
Recent Posts


GET MORE INFORMATION


